
As I said, Alexander Moss’s new book, “A More Perfect Union” is a sound basis for disunion.
Moss’s hypothetical breakup was into six new nations, based on contiguousness and common characteristics of the states.
I have used the numbers in the first two posts on New Harmony to instead propose five new countries, based on political leanings as well as the other factors. In other words I want to make sure as few red citizens as possible are under a new blue federal government and as few blue citizens as possible are under a new red federal government.
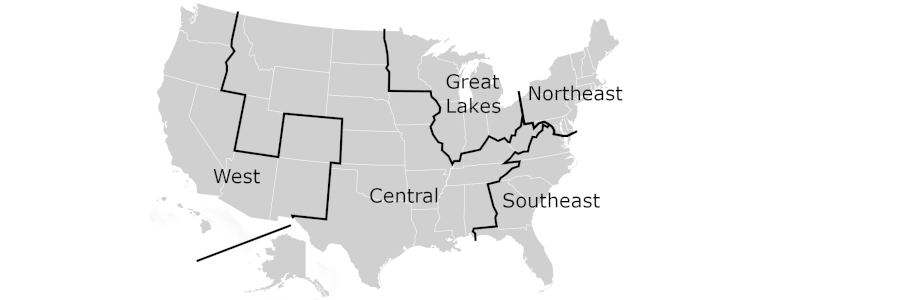
Here is the map:

Here are the states and compositions for the five new countries. The Senate column is the number of Democrats of the two US Senators.:
West:
State          population  Senators  House D  House R

California     39,538,223        2     42      11
Arizona         7,151,502        2      5       4
Washington      7,705,281        2      7       3
Colorado        5,773,714        2      4       3
Oregon          4,237,256        2      4       1
Nevada          3,104,614        2      3       1
New Mexico      2,117,522        2      2       1
Hawaii          1,455,271        2      2       0

total          71,083,383

Total U.S.    331,454,351

                    percent    100     74
statehouses:
State          population  Governor  Senators D  Senators R  House D  House R

California     39,538,223     D          30          9         60       9
Washington      7,705,281     D          29         20         57      41
Colorado        5,773,714     D          20         15         41      24
Oregon          4,237,256     D          18         11         37      23
Nevada          3,104,614     D          12          9         26      16
New Mexico      2,117,522     D          27         15         45      24
Hawaii          1,455,271     D          24          1         47       4
Arizona         7,151,502     R          14         16         28      31

total          71,083,383

percent                      88          64                    66

Total U.S.    331,454,351
Central:
State          population   Senators   House D  House R

Texas          29,145,505         0       12     24
Tennessee       6,910,840         0        2      7
Alabama         5,024,279         0        1      6
Louisiana       4,657,757         0        1      5
Kentucky        4,505,836         0        1      5
Oklahoma        3,959,353         0        0      5
Utah            3,205,958         0        0      4
Arkansas        3,011,524         0        0      4
Mississippi     2,961,279         0        1      3
Kansas          2,937,880         0        1      3
Wyoming           576,851         0        0      1
Nebraska        1,961,504         0        0      3
Idaho           1,839,106         0        0      2
West Virginia   1,793,716         1        0      3
Montana         1,084,225         1        0      1
South Dakota      886,667         0        0      1
North Dakota      779,094         0        0      1
Alaska            733,391         0        0      1
Missouri        6,154,913         0        2      6
Iowa            3,271,616         0        1      3

total          85,401,294

Total U.S.     331,454,351

                    percent       5       20
statehouses:
State          population  Governor  Senators D  Senators R  House D  House R

Texas         29,145,505      R          12         19         67     82
Tennessee      6,910,840      R           6         27         26     73
South Carolin  5,118,425      R          16         30         43     81
Alabama        5,024,279      R           7         26         28     77
Louisiana      4,657,757      D          12         27         35     67
Kentucky       4,505,836      D           8         30         25     75
Oklahoma       3,959,353      R           9         39         19     82
Utah           3,205,958      R           6         23         17     58
Arkansas       3,011,524      R           7         27         22     78
Mississippi    2,961,279      R          16         36         46     75
Kansas         2,937,880      R          11         29         41     84
Wyoming          576,851      R           2         28          7     51
Nebraska       1,961,504      R
Idaho          1,839,106      R           7         28         12     58
West Virginia  1,793,716      R          11         23         23     77
Montana        1,084,225      R          19         31         33     67
South Dakota     886,667      R           3         32          8     62
North Dakota     779,094      R           7         40         14     80
Alaska           733,391      R           7         13         15     21
Missouri       6,154,913      R          10         24         48    114
Iowa           3,271,616      R          18         32         41     59

total         85,401,294

percent                      10          25                    29

Total U.S.   331,454,351
Great Lakes:
State          population   Senators   House D  House R

Ohio           11,799,448         1        4     12
Illinois       12,801,989         2       13      5
Michigan       10,077,331         2        7      7
Minnesota       5,706,494         2        4      4
Wisconsin       5,893,718         1        3      5
Indiana         6,785,528         0        2      7

total          53,064,508

Total U.S.    331,454,351

                    percent      67       45
statehouses:
State          population  Governor  Senators D  Senators R  House D  House R

Ohio           11,799,448     R           8         25         35      64
Michigan       10,077,331     D          16         22         52      58
Minnesota       5,706,494     D          31         34         70      64
Wisconsin       5,893,718     D          12         20         38      60
Indiana         6,785,528     R          11         39         29      71
Illinois       12,801,989     D          41         18         73      45

total          53,064,508

percent                      67          43                    45

Total U.S.    331,454,351
Northeast:
State          population  Senators  House D  House R

New York       20,201,249        2     19       8
New Hampshire   1,377,529        2      2       0
New Jersey      9,288,994        2     10       2
Pennsylvania   13,002,700        1      9       9
Connecticut     3,605,944        2      4       0
Maine           1,362,359        1      2       0
Rhode Island    1,097,379        2      2       0
Delaware          989,948        2      1       0
DC                689,545               1       0
Massachusetts   7,029,917        2      9       0
Maryland        6,177,224        2      7       1
Vermont           643,077        2      1       0

total          65,465,865

Total U.S.    331,454,351

                    percent     91     77
statehouses:
State          population  Governor  Senators D  Senators R  House D  House R

New York       20,201,249     D          43        20         106      43
Connecticut     3,605,944     D          23        12          97      54
New Jersey      9,288,994     D          25        15          52      28
New Hampshire   1,377,529     R          10        14         187     213
Pennsylvania   13,002,700     D          21        27          90     112
Massachusetts   7,029,917     R          37         3         128      30
Maryland        6,177,224     R          32        15          99      42
Vermont           643,077     R          21         7          93      46
Maine           1,362,359     D          21        13          80      66
Rhode Island    1,097,379     D          33         5          65      10
Delaware          989,948     D          14         7          26      15
DC                689,545     D          11         0

total          65,465,865

percent                      67          68                    61

Total U.S.     331,454,351
Southeast:
State           population  Senators  House D  House R

Virginia         8,631,393        2      7       4
North Carolina  10,439,388        0      5       8
South Carolina   5,118,425        0      1       6
Georgia         10,711,908        2      6       8
Florida         21,538,187        0     11      16

total           56,439,301

Total U.S.     331,454,351

                    percent      40     42
statehouses:
State          population  Governor  Senators D  Senators R  House D  House R

Florida        21,538,187     R          16        24          42      78
Georgia        10,711,908     R          22        34          76     103
North Carolin  10,439,388     D          22        28          51      69
South Carolin   5,118,425     R          16        30          43      81
Virginia        8,631,393     R          21        18          55      45

total          56,439,301

percent                      20          42                    42

Total U.S.    331,454,351
The state level numbers here were not in previous posts.
Here are the sources:

Comments